
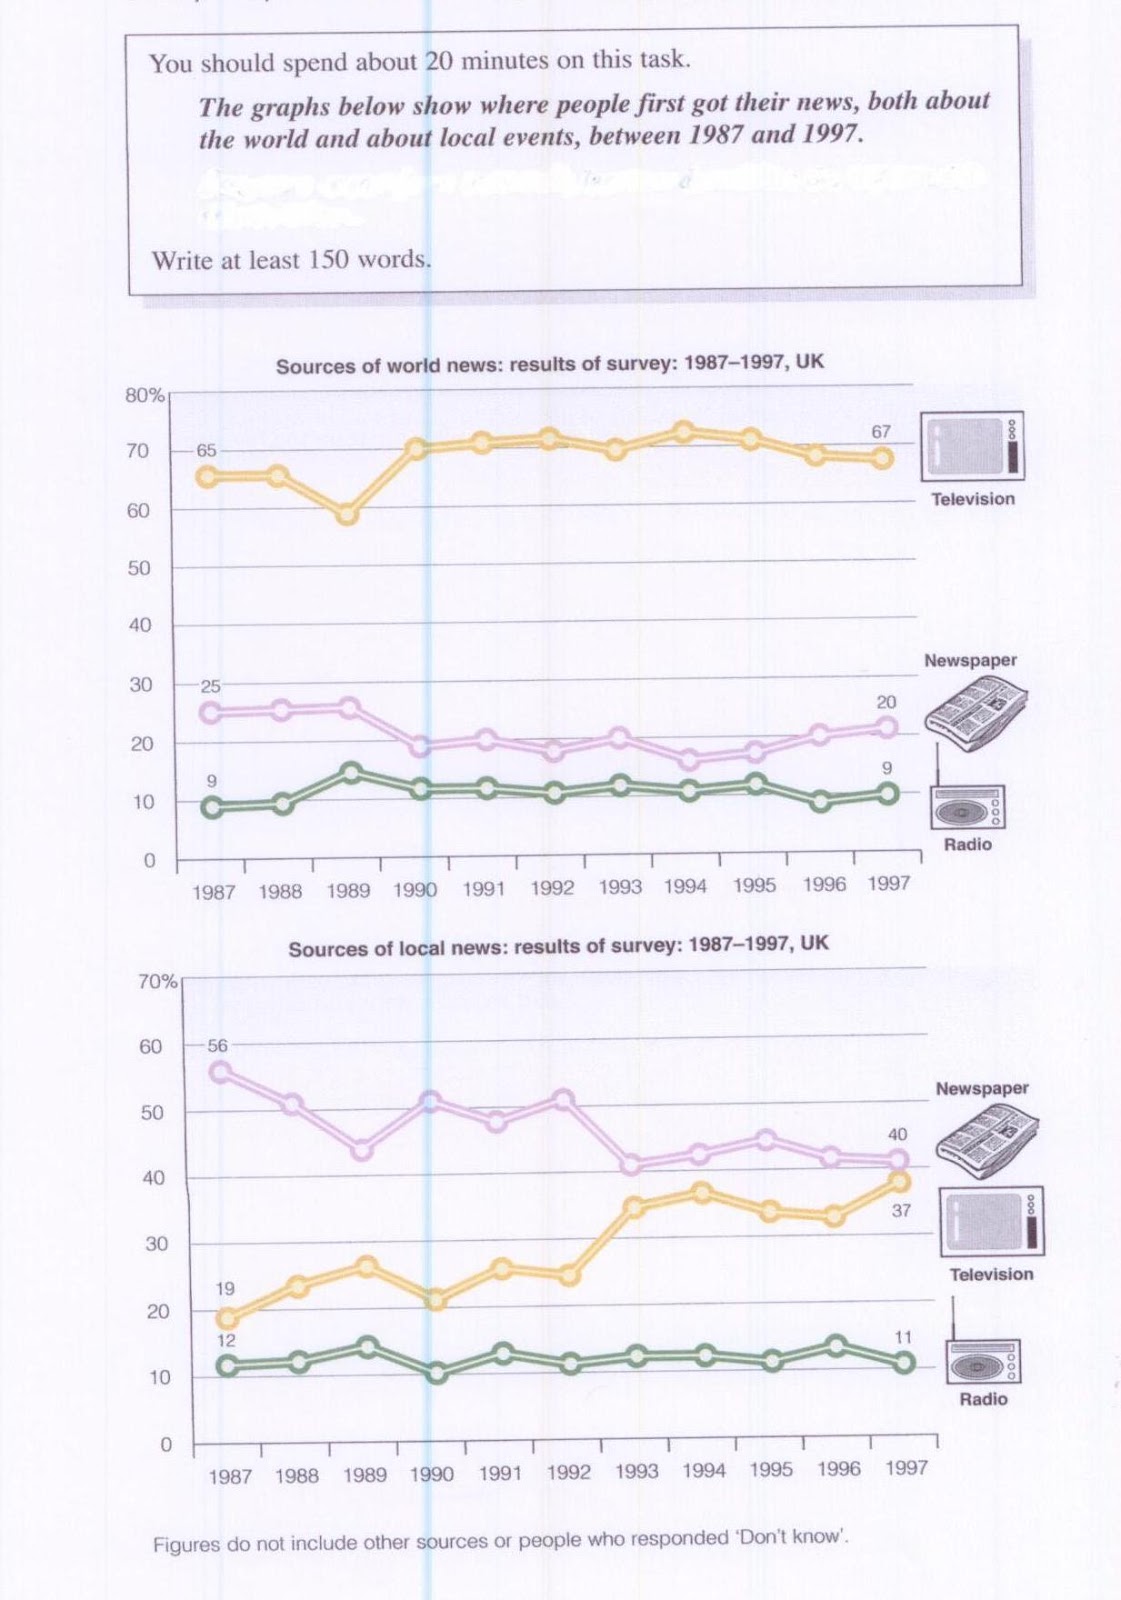
The line graphs show the sources of local and world news in the UK over a ten year period, from 1987 to 1997.
65% of people in the UK initially received their news via television in 1987 and ten years later this percentage increased by 2. In 1989 there was a 5% drop in this source of world news while between 1990 and 1996 the percentage was stable at 70. Between 1987 and 1989, 25% of world news was obtained via newspaper. This dropped by 5% in 1997, with the lowest point being reached in 1994 at 15%. Finally, only around 9% of world news was accessed by radio between this period with the exception of 15% in 1989.
In 1987, 56% of local news was read in the newspaper at first and this fell by 16% ten years later, with an upward trend being observed in 1990 and in 1992 where access reached 50%. Television as a source of local news experienced an upward trend from 19% initially to 37% in 1997. A low point can be seen in 199 at 19%. Lastly, radio was used at a stable rate of about 12% throughout the given time to find out about local news.
Most international news in the UK was first seen on the television and about half the respondents used the newspaper for this. Very few listened to world news on the radio. The percentages were stable over 10 years. Newspapers were favoured over television for local news, but this source lost its popularity and television increased its local news viewership. Radio access remains low.
Question taken from focus on IELTS, Longman p.117


This comment has been removed by the author.
ReplyDeleteThe line charts illustrate the comparison of which mass media chosen in the UK from global and local news in percentage over a decade between 1987 and 1997.
ReplyDeleteOverall, it is obvious that the most preferable resource in global news dominated by television, but in local news had newspaper as the most one. Moreover, both of these countries had a radio in the least accessible news resource amongst the others.
In the resource of global news, after television stood and grew stable at 65% in two years, it then dipped gradually to reach about 59% in 1989. This number saw a noticeable increase by 11% just merely in one year before fluctuated gradually at 68% over 7 months. However, the figure of newspaper and radio had a lower percentage just under 30%. Moreover, while the former grew in stable and it declined gradually before reaching a stable growth at 19% to the rest of the years, the latter experienced a small increase and saw an eight relatively stable plateau of about 9%.
Regarding to local news, newspaper stood at 56%, three times higher than that of television (19%). It then decreased gradually to reach 43% in 1989 before fluctuating over 47% to the year of 1993 after which experienced a relatively stable to the end of the year at 40%. Then the latter rose steadily reaching to 27% in 1989. There was a slight fluctuated movement at the previous same level and grew sharply over 33% in 1993, following which the figure saw a remaining static over four years later as this make it closer to the former of about 36%. However, from 1987 to 1997 the radio reached a mild stable movement approximately 11%. (284)
By Ari Jogja